Visual wealth dashboard with zero setup
Start free with 12-month history. Get net worth trend charts, allocation treemaps, and month-over-month progress indicators automatically from your monthly snapshots. No manual chart building.
No credit card required
Wealth monitoring doesn't need to be complicated. MonthlyWorth gives you a visual dashboard with net worth trends, category breakdowns, and allocation charts - all generated automatically from your monthly snapshots. No setup required beyond creating your categories. Enter your values once a month and watch your financial picture come into focus over time.
Complexity You Don't Need
Common frustrations we solve
- Checking account balances across multiple apps gives no unified picture of progress
- Spreadsheet charts break constantly and need manual rebuilding every month
- No easy way to see whether your overall wealth is trending up or down over time
Why MonthlyWorth?
- Start free - no credit card required for 12-month dashboard access
- Three automated chart types update instantly after each check-in
- Responsive design: monitor progress on mobile, tablet, or desktop
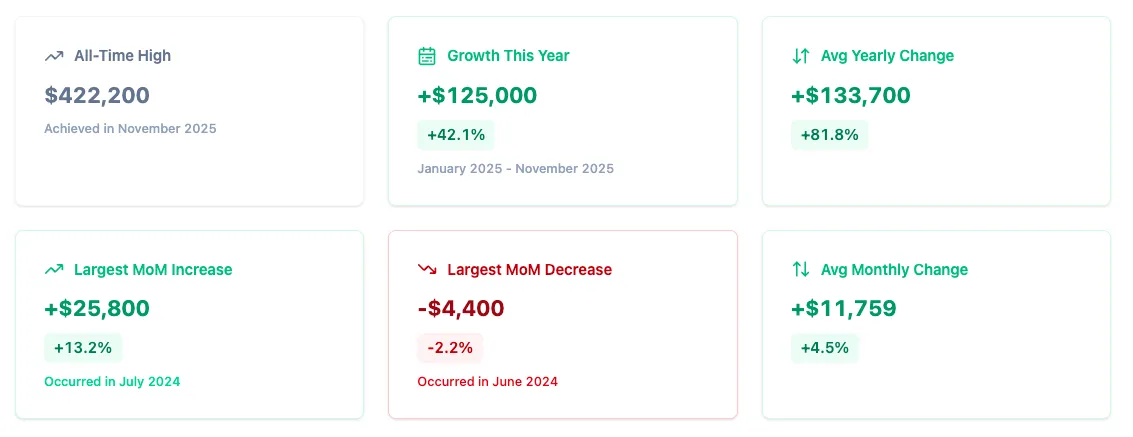
- Premium Insights: all-time high, year-to-date growth, monthly change metrics
Key Features
Minimal features for maximum financial clarity
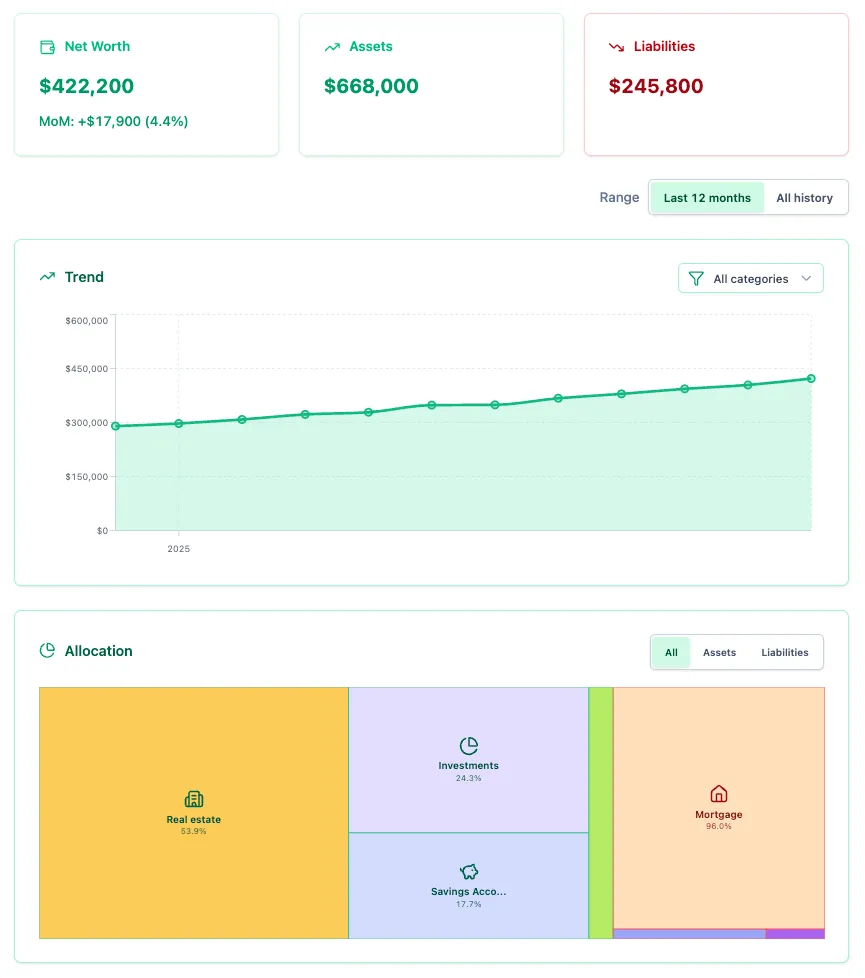
- Net worth trend line chart showing month-over-month wealth progression
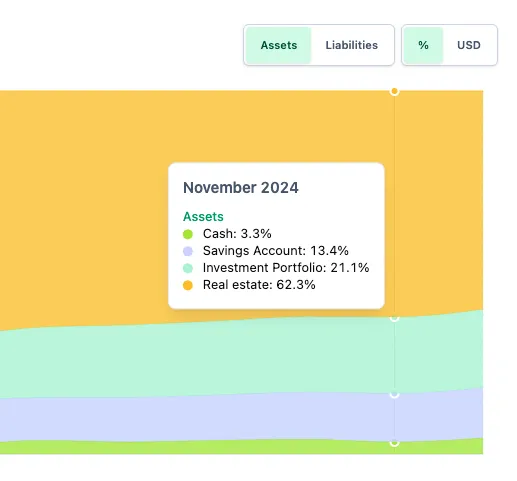
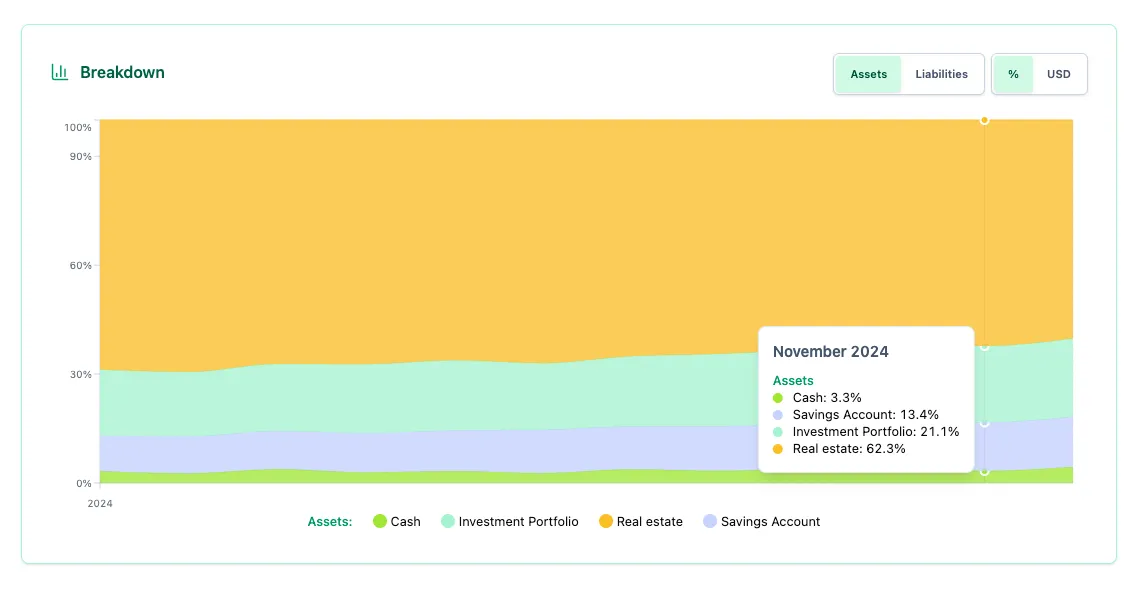
- Category stacked area chart revealing how each asset and liability changes over time
- Allocation treemap for a visual snapshot of where your money lives right now
- Month-over-month change indicators on the dashboard for quick progress checks
- Premium Insights with all-time high tracking, YTD growth, and performance metrics
- Optional email reminders so you never miss a monthly data point
See MonthlyWorth in Action
A visual overview of how the app helps you track your net worth
How It Works
Get started in minutes
- 1
2-minute onboarding: set your currency and create asset/liability categories
- 2
Enter balances once per month via the guided check-in wizard
- 3
Dashboard updates instantly with trend charts and allocation breakdown
- 4
Review month-over-month changes and track progress toward financial goals
Your dashboard, your data, your control
- Secure authentication keeps your financial dashboard private
- Database-level isolation: your wealth data never mixes with others
- Charts render locally in your browser - no data sent to third parties
- End-to-end encryption protects dashboard data in transit and at rest
- Export your full history as CSV for offline analysis anytime
Frequently Asked Questions
What charts and dashboards does MonthlyWorth provide?
How do I track progress toward financial goals?
Can I see how individual categories change over time?
Do dashboards update automatically after each check-in?
Ready to get started?
Join MonthlyWorth today and start tracking your net worth with privacy and control.
No credit card required
Related Solutions
Simplicity
Simple net worth tracking without the complexity
Track net worth without complexity. Monthly check-ins replace daily transaction chaos. No budgeting, no bank sync. Start free with 12-month history.
Learn moreSimplicity
Build a monthly check-in habit that sticks
Build a 5-minute monthly check-in habit for net worth tracking. Guided wizard, automatic charts, email reminders. No daily logging required. Start free.
Learn moreSpreadsheet
Replace your spreadsheet, keep manual control
Graduate from spreadsheets to MonthlyWorth's guided snapshots. Start free with 12-month history, upgrade for $3/month or $24/year. No formula maintenance.
Learn more